
Administrator’s guide to live dashboard featuring the data of your enterprise’s call activities from Studio, Ubity’s online management portal.
1 Log into the Ubity web interface
Username: your e-mail address
To obtain a password, you must request one on the interface (click on Recover your password) because Ubity does not have access to them for security reasons.
2 Live dashboard
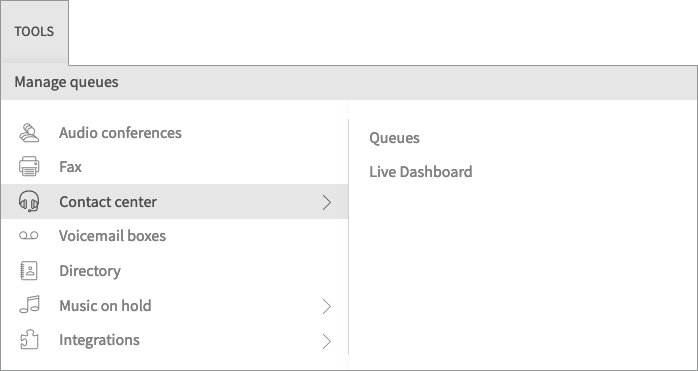
- Go to the Tools tab, click on Contact Center, and then click on Live dashboard.
- Go to the Tools tab, click on Contact Center. Select the Call queue tool, and then click on Live dashboard in the upper right corner.
This tool allows you to view the data of your call queues and agents in one glance. The dashboard can be customized to display the data that is relevant to your organization.
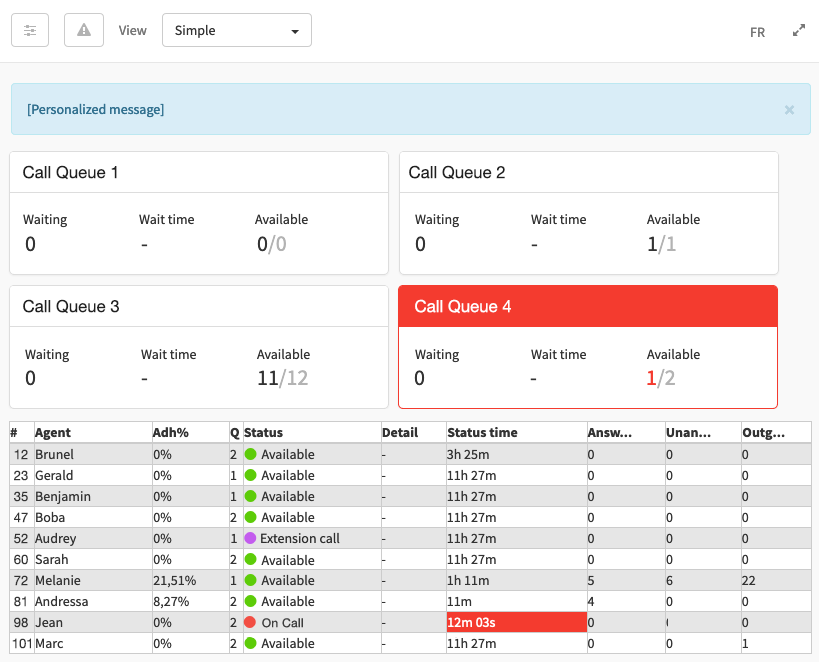
Main screen
The data generated by your contact center call activity is divided into two sections: the upper part of the main screen displays the call queue data, and the lower part displays the agent data from the contact center.
It is possible to drag and drop the call queues to reorganize their layout in the dashboard.

Full screen mode
![]() Click the arrows icon to display the live dashboard in full screen mode.
Click the arrows icon to display the live dashboard in full screen mode.
Press the Escape key on your keyboard to exit full screen mode.
Parameters
![]() Click the Parameters icon in the upper left corner of the dashboard to access its settings.
Click the Parameters icon in the upper left corner of the dashboard to access its settings.
General
![]() Click the Parameters icon, then select the General tab to customize the data to be displayed in the Call queues and Agents sections, respectively. See point 3 and 4 below for more details.
Click the Parameters icon, then select the General tab to customize the data to be displayed in the Call queues and Agents sections, respectively. See point 3 and 4 below for more details.
Message
![]() Click the Parameters icon, then select the Message tab to customize the message that will be visible to all users at the top of the dashboard.
Click the Parameters icon, then select the Message tab to customize the message that will be visible to all users at the top of the dashboard.

You can give it priority:
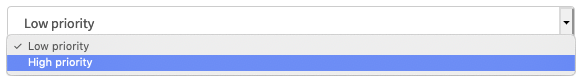
- Low: the message will be highlighted in blue
- High: the message will be highlighted in red

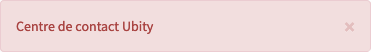
Click on Publish to display the message at the top of the dashboard, or the ![]() to its right to remove it.
to its right to remove it.
Style
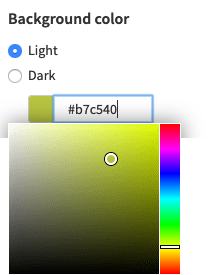
![]() Click the Parameters icon, then select the Style tab to change the background color of the dashboard.
Click the Parameters icon, then select the Style tab to change the background color of the dashboard.

The background style can be modified according to your preference of Light or Dark, or to the image of your organization by giving it a specific color.
Alerts
Visual alerts draw your attention to data that exceeds the thresholds you have set.


It is possible to drag and drop the alerts to reorganize their layout on the screen.
3 Call queue data
Types of views
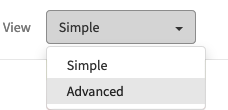
Two types of views allow you to browse this data, the Simple view and the Advanced view.
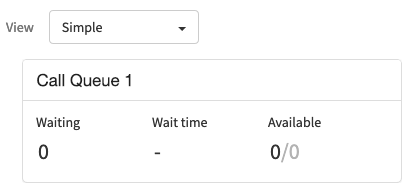
Simple view
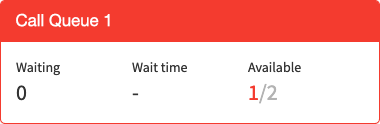
The Simple view displays the three basic details:
- The number of calls waiting in the queue
- The waiting time of the call which has been waiting in the queue for the longest time
- The number of agents available in the queue
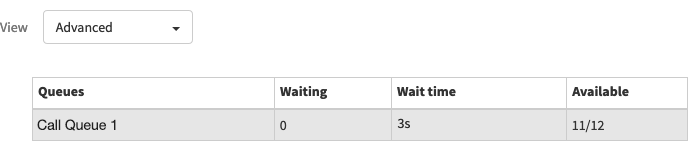
Advanced view
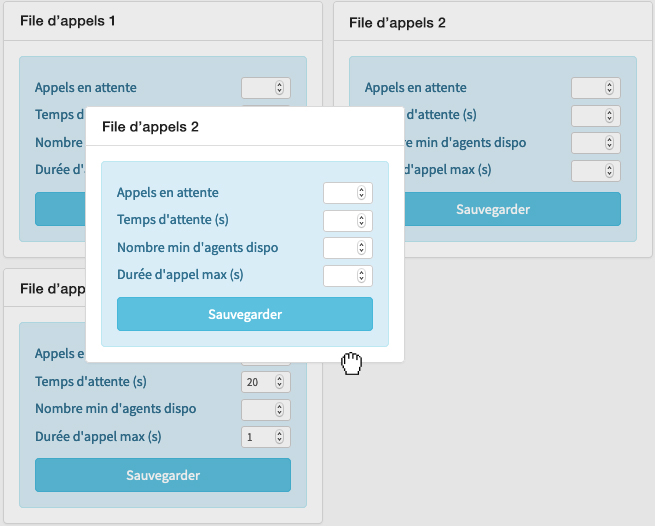
The Advanced view allows you to display additional details according to your needs, which you can configure in the Parameters presented below.
Data
- Queues: Name of the call queues
- Waiting: Number of calls waiting in the queue
- Wait time: Waiting time of the call which has been waiting in the queue for the longest time
- Available: Number of agents available in the queue; the first digit represents agents whose status is Available, and the second digit represents all connected agents, regardless of their status
- Total calls: Total number of calls that were connected to the queue, answered or not
- Answered: Total number of calls that were connected to the queue and answered by an agent
- Unanswered: Total number of calls that were connected to the queue but not answered by an agent
This includes when the caller hangs up before an agent answers, when the caller uses an exit key (e. g. to leave a voicemail or to select the Call Back option), or when the call is removed from the queue based on its configuration (e. g. when the maximum call processing time is reached). - Avg wait time: Average call queue waiting time (represents the sum of the waiting times for each answered call divided by the total number of answered calls)
- Avg aban time: Average abandonment waiting time (represents the sum of the waiting times for each call that left the queue without being answered, divided by the total number of unanswered calls)
- Avg talk time: Average talk time (represents the sum of the talk times of each answered call divided by the total number of answered calls)
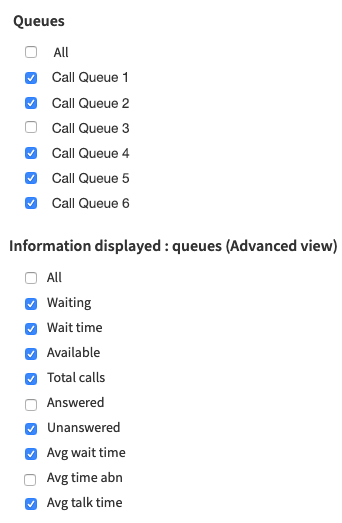
Parameters
![]() Click the Parameters icon, then select the General tab to customize the data to be displayed in the Call queues section of the dashboard.
Click the Parameters icon, then select the General tab to customize the data to be displayed in the Call queues section of the dashboard.
- Select the call queues to display
- Select the data to be displayed in the Advanced view
4 Agent data
This section allows you to display several details according to your needs, which you can configure in the Parameters presented below.
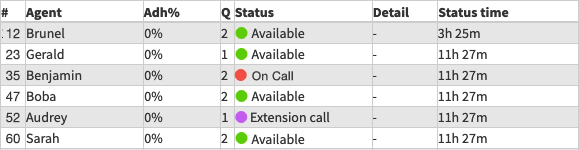
Data
- # (Agent extension): Phone extension of the agent
- Agent (Agent name): Name given to the extension of the agent
- Adh% (Adherence %): Percentage representing the ratio of time the agent is on call to the time he is connected to the queue
- Q (Queues): Number of call queues to which the agent is connected
- Status: Status of the agent in the call queue
- Detail: Informative detail related to the agent’s status (e. g. the queue the current call is in, or the description explaining the status on pause)
- Status time: Time elapsed since the agent is in his current status
- Answered: Number of calls answered by the agent
- Unanswered: Number of calls forwarded to the agent without the agent answering
- Outgoing: Number of calls made by the agent, regardless of his call queue or destination
Statuses
![]() Available: The agent is connected to a call queue and available to receive calls
Available: The agent is connected to a call queue and available to receive calls
![]() On call: The agent is connected to a call queue and is currently on a call from the queue
On call: The agent is connected to a call queue and is currently on a call from the queue
![]() Extension call: The agent is connected to a call queue, but is currently on call directly on his personal extension
Extension call: The agent is connected to a call queue, but is currently on call directly on his personal extension
![]() On pause: The agent is connected to a call queue but has manually put his status on pause; he temporarily cannot receive calls from the queue
On pause: The agent is connected to a call queue but has manually put his status on pause; he temporarily cannot receive calls from the queue
![]() Wrap up: The agent is connected to a call queue but is in a wrap-up period following a call; he temporarily cannot receive calls from the queue for the duration configured in the queue parameters
Wrap up: The agent is connected to a call queue but is in a wrap-up period following a call; he temporarily cannot receive calls from the queue for the duration configured in the queue parameters
![]() On hold: The agent is connected to a call queue and is on a call from the queue, but this call is currently placed on hold by the agent
On hold: The agent is connected to a call queue and is on a call from the queue, but this call is currently placed on hold by the agent
Parameters
![]() Click the Parameters icon, then select the General tab to customize the data to be displayed in the Agents section of the dashboard.
Click the Parameters icon, then select the General tab to customize the data to be displayed in the Agents section of the dashboard.
- Select the status of the agents to display
- Select the agent-related data to be displayed

